
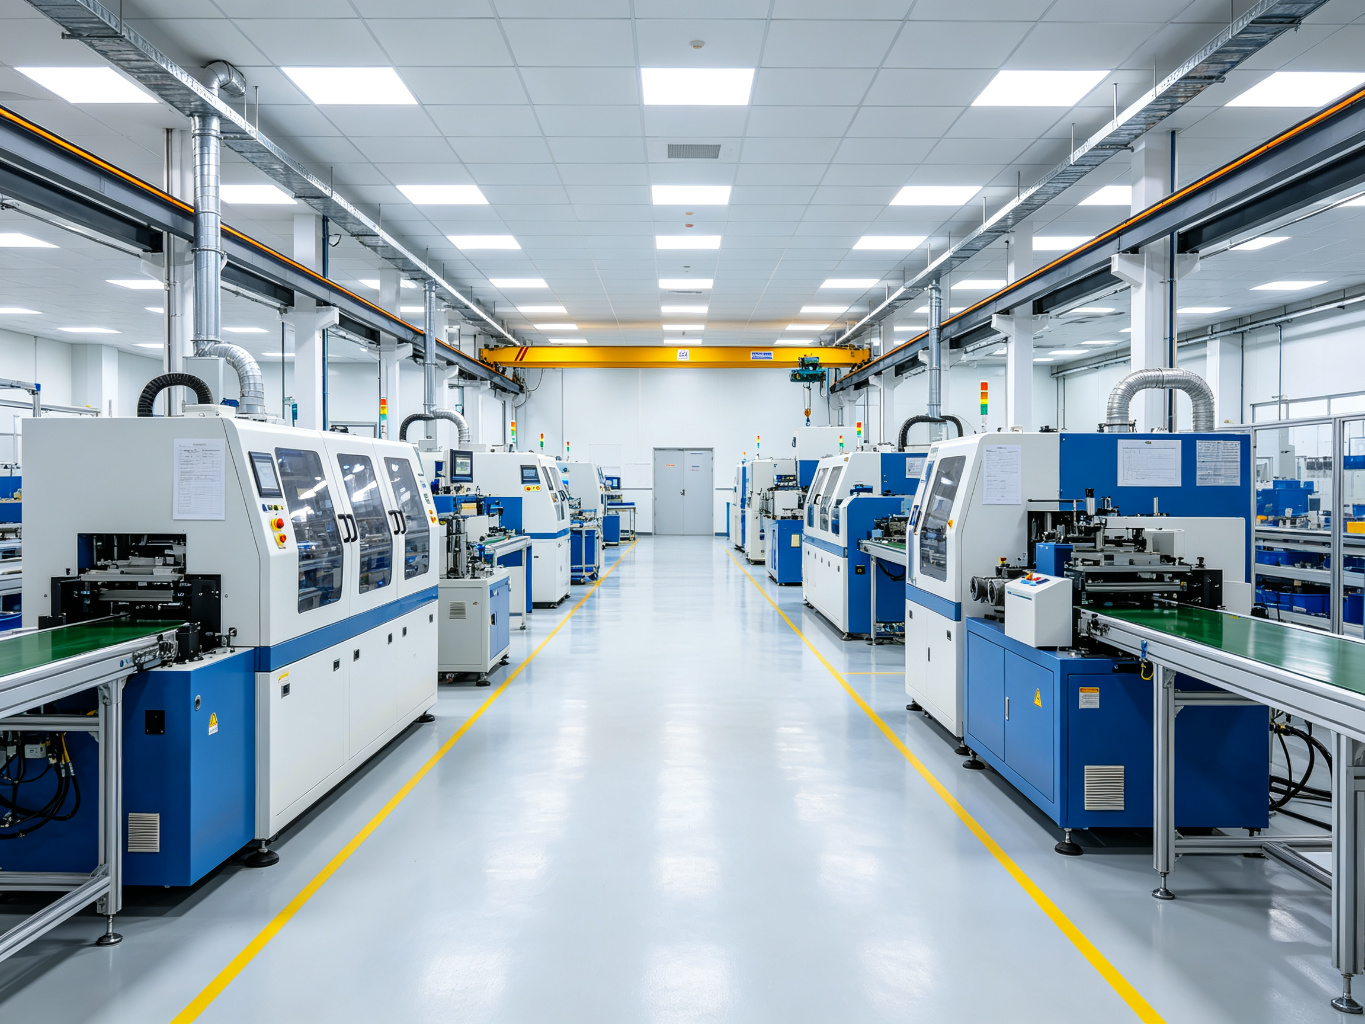
Packaging Line ROI Calculator: How to Calculate Payback Period
How to calculate the real ROI of an automated packaging line — labor savings, material waste reduction, throughput gain, maintenance costs. A practical framework to justify your next packaging equipment investment.
- Typical payback 12–24 months
- 4 core ROI components
- Real-world examples included
By Ryan Huang, Sales Application Engineer — System Configuration. Ryan builds payback and ROI models for packaging automation projects, reviewing labor setup, waste rates, throughput limits and maintenance cost before a buyer commits to capital equipment.
Why Most ROI Calculations Are Wrong
Most companies evaluate packaging equipment by comparing the purchase price to the nearest competitor’s price. That is the wrong calculation. The real question is how much money this machine will make or save you over its lifetime, and how soon the investment pays itself back. A price comparison tells you what the machine costs today; an ROI calculation tells you what it returns over the ownership period.
A $50,000 case erector that saves three operators at $40,000 a year each pays for itself in about five months on labor alone. A $30,000 cheaper machine that breaks down every other week and produces 5% waste can cost you more money over five years, because the savings never land and the downtime keeps compounding. The cheaper purchase price and the cheaper five-year outcome are two different things.
This guide walks through the four core components of packaging line ROI, the payback formula, the hidden costs that erase a good-looking number, typical payback periods by machine type, and a conservative way to present the case to finance and management. The labor, waste and throughput figures in the examples are planning bands; replace them with your own plant numbers before you approve a purchase. A strong ROI proposal separates what the machine costs today from what it returns over its service life, and it shows that return on your own baseline rather than on a vendor’s best-case scenario.
The ROI and Payback Formula in Plain Terms
Payback period answers one question: how long until the annual savings cover the total investment. The basic calculation is:
Payback period (years) = Total investment ÷ Annual net savings.
Total investment includes the machine price, installation and commissioning, training, initial tooling and any integration work. Annual net savings are the recurring annual gains after subtracting the new machine’s own maintenance, utilities and consumable cost. Return on investment (ROI) then expresses those net savings as a percentage of the investment each year:
Annual ROI (%) = Annual net savings ÷ Total investment × 100.
Two rules keep the model honest. First, use net savings, not gross savings: a new line adds maintenance, air and power cost that must come out of the annual gain before you divide. Second, value throughput gains at gross profit per extra case, not at full revenue. A case that earns $2 of margin adds $2 an hour of value when the line unblocks it; counting the full sale price overstates the return.
The 4 Core Components of Packaging Line ROI
Labor Savings
The biggest and most obvious ROI component. Count how many operators you can eliminate, but do not stop at headcount. Add overtime, temp labor, supervision time, night-shift premium and the labor spent covering absences. A line that one operator watches across two machines saves more than the headcount on paper.
Material Waste Reduction
Automatic machines use less tape, less stretch film, less strapping and produce fewer damaged cartons. Typical waste reduction lands in a 3–8% band on packaging material cost, depending on how much hand packing and hand sealing happens today. Measure your current waste before and after, because the gap between manual and automatic handling is where this saving comes from.
Throughput Gain
If your packaging line is the bottleneck, automating it can increase overall plant output. Every extra case per minute is more revenue per shift, but value it at the margin that extra case earns. This component is often the most valuable one in a plant that cannot take on more customers because the end of line cannot keep up.
Quality and Damage Reduction
Better packaging means fewer customer complaints, fewer damaged-goods returns and better brand reputation. This is harder to quantify than labor, but it is real: returns, relabeling and complaint handling carry labor and freight that do not appear in the machine OEE log. Track defect and return rates before and after to put a number on it.
Counting Labor Correctly
Labor is the component buyers count most often, and the one they most often under-count. The simple version looks at operators standing at the machine. The full version looks at every person whose time touches the packaging cell across the shift.
Start with direct operators: how many people pack, seal, strap, wrap or palletize by hand today, and what is their loaded hourly cost once payroll taxes, benefits and shift premiums are included. Then add indirect labor: the supervisor who spends part of each shift troubleshooting or reworking packs, the temp labor brought in during peak season, the overtime paid at month-end or holiday runs, and the training cost when an operator turns over. A manual line that looks like four operators may carry a fifth person’s worth of indirect time once those items are added.
When automation replaces manual stations, it rarely removes every person. A new end-of-line cell usually leaves one operator to feed, monitor and handle exceptions. Model the saving as the operators removed, not the operators left behind, and budget the retained operator’s skill level and training. The PMMI workforce and automation background tracks why plants are shifting this labor toward automated cells as staffing pressure rises.
Material Waste and Consumable Math
Material waste shows up in tape, film, strap, cartons and damaged product. On a manual line, tape is applied by hand and can be stretched or doubled; film is pulled loose by hand on a stretch station; cartons are crushed or dropped during manual packing. Each small loss repeats on every pack, so a fraction of a percent on one case builds into a large annual material bill.
To size this component, take your current annual spend on packaging material, estimate the share currently lost to waste, and apply a conservative waste-reduction band after automation. Keep the new machine’s own consumable requirement in the same line: a servo wrapper that uses less film than a hand station may still need film, film tail clamps or stretch film consumables. For the palletizing side, the comparison between manual and automated wrapping in the pallet wrapper versus manual wrapping total-cost guide shows how film and labor combine on a loaded pallet.
When Throughput Is the Real Payback
Some packaging investments pay back mainly on labor. Others pay back mainly because the line was stopping the plant from growing. If your end-of-line cell runs at capacity and orders are being turned down or scheduled out, the value of automation is not just the labor it saves — it is the extra cases the plant can ship. In that situation, the throughput component can outweigh labor savings within the first year.
Value this conservatively: count only the extra cases you can realistically sell, at the margin those cases earn, and assume the line reaches target rate after a commissioning ramp rather than on day one. The dairy case study below shows this growth case in practice. For a wider view of where automation capacity and labor costs are heading, see the end-of-line automation market, capacity and labor cost guide 2026.
Sample ROI Calculation: End-of-Line System
| Component | Current (Manual) | Automated Line | Annual Savings |
|---|---|---|---|
| Operators needed | 5 people × $45k = $225k | 2 people × $45k = $90k | $135,000 |
| Stretch film waste | 12% waste | 3% waste | $8,500 |
| Tape / strapping waste | 8% waste | 2% waste | $4,200 |
| Damaged cartons / returns | 1.5% of cases | 0.4% of cases | $22,000 |
| Overtime / temp labor | $35,000/year | $5,000/year | $30,000 |
| Total annual gross savings | — | — | $199,700 |
Don’t Forget These Hidden Costs
Typical Payback Periods by Machine Type
Case Erector + Sealer
Typical payback 12–18 months. Saves two to three operators immediately and removes manual case forming and sealing defects. Usually the strongest first automation step for a growing plant.
Robotic Palletizer
Typical payback 18–30 months. Higher upfront cost, but replaces heavy manual labor, works around the clock and reduces repetitive-strain handling. See the palletizer buying guide 2026 for the robotic, conventional and cobot options.
Shrink Wrapper / Stretch Wrapper
Typical payback 12–24 months. The return mixes labor savings with material waste reduction, and improves load stability in transit.
Full End-of-Line Line
Typical payback 18–24 months. Bigger investment, but the integration bonus adds 10–15% extra savings because the cells hand off cleanly instead of relying on manual transfer.
Real-World Example: Dairy Plant Expansion
A dairy plant was running two shifts, packing yogurt cups manually. It was at maximum capacity and could not take on more customers. The team was deciding whether to add a third shift, which means more labor, or automate the end of line.
Option A: third shift. Four more operators at $50k a year each = $200k a year extra labor, plus recruitment, training, supervision and quality-control issues with night-shift staff.
Option B: automated end-of-line. $220k investment, saves three operators across two shifts = $150k a year labor savings. Around 5% less product damage = $35k a year. The line could also run faster = 15% more output = $400k a year extra revenue, valued at the margin that added volume earns.
Result: They chose Option B. Payback was eight months on the conservative labor and damage numbers alone. They did not just save money; they grew revenue because the line was no longer the bottleneck. This is the most powerful ROI case: when the packaging line is your constraint, automating it does not just cut labor — it unlocks growth.
When Automation Does Not Pay Back
Not every packaging investment clears the bar. A small, one-shift, single-SKU operation with low labor cost and steady demand may not generate enough recurring saving to justify a servo line. A plant that packages a fragile or constantly changing product, where recipe changes outpace machine flexibility, can end up paying for capability it never uses. A purchase driven by showroom appeal rather than a measured labor, waste or throughput gap rarely pays back on schedule.
Run the conservative case before the optimistic one: assume savings arrive six months late, waste reduction lands at the lower end of the band, and throughput gains count only sellable cases at margin. If the investment still pays back inside two years on those numbers, it is a defensible proposal. If it only clears the bar on the optimistic assumptions, the case is weak.
For equipment that does pay back on a smaller scale, the case erector buying guide with pricing and ROI comparison lays out how machine class and configuration change the payback profile, and the collaborative robots in packaging adoption and payback guide covers the lighter-investment automation end.
Reading a Vendor Proposal for Hidden Scope
Two quotations can look close on price while carrying very different scope, and the missing scope usually shows up later as added cost. When you compare proposals, check what each one includes rather than trusting the headline number.
Confirm whether conveyors, guards, safety fencing, sensors, reject stations and the line controller are in the machine price or listed separately. Check whether installation, rigging, electrical and pneumatic connection, commissioning and operator training are included. Ask which wear parts and the first spare kit ship with the machine, and whether consumables such as film, tape or strap are expected to be a specific brand or specification. A bid that bundles these into one price and a bid that strips them out are not comparable until the missing items are priced back in.
Also look at what the proposal commits to on performance. A generic speed figure measured on the easiest pack is not the same as an availability or MTBF commitment tied to your product mix. Ask for the reference installation, the expected changeover time for your SKU range, and the spare-parts lead time on the most likely failure items. These commitments determine whether the projected savings actually land, and they belong in the ROI model alongside the machine price.
How ROI Changes by Plant Size and Shift Pattern
The same machine can pay back quickly in one plant and slowly in another, because the recurring savings scale with hours, labor cost and throughput pressure. Matching the equipment to the plant profile matters as much as the machine’s technical spec.
One-shift, single-SKU, low volume. Labor and downtime savings are modest because the line runs few hours. A simple, reliable machine that matches one product usually makes sense; a high-end servo cell may not recover its premium. Keep the investment small and the payback short.
Two- to three-shift, mixed SKU. Labor, downtime and changeover all compound across hours and SKU switches. This is where reliability, fast changeover and automation earn their return, and where a higher-spec machine most often wins the five-year comparison. The recurring layers dominate the invoice price.
Growth-constrained plant. If packaging is the bottleneck stopping you from taking orders, throughput gain can be the largest ROI component, even ahead of labor. Value the extra sellable cases at their margin, and plan the commissioning ramp so the new capacity comes online before the next peak season.
High-labor-cost region. Where loaded operator wages are high, labor savings arrive faster and simpler automation steps pay back in under a year. Where labor is cheap, material waste, damage reduction and throughput usually carry more of the case, and the payback threshold for a large cell rises.
Phased Automation: Where to Spend First
Not every plant can fund a full end-of-line cell at once. The ROI framework also helps sequence a phased rollout, where each stage pays back before the next one is funded. The usual first step is the station that removes the most manual labor or causes the most damage: a case erector and sealer for a plant hand-forming and hand-sealing cartons, or a stretch wrapper for a plant hand-wrapping loaded pallets. Once that stage is running and its savings are visible, the next stage — a case packer, a palletizer or a conveyor link — can be justified on its own payback rather than on a single large capital request.
Phasing reduces two risks. It keeps each investment small enough to clear the payback bar on its own numbers, and it lets the team learn automation on one cell before extending controls and integration across the line. The trade-off is that staged cells may need temporary manual transfer between stages, so plan the infeed and outfeed so each later machine drops into the existing layout without rework.
When you compare a single full-line proposal against a staged plan, price both on the same five-year horizon. The full line often earns a 10–15% integration bonus from clean handoffs, but the staged plan spreads cash out and defers the risk of a large upfront commitment. Which wins depends on your labor pressure, growth outlook and capital availability, not on the headline machine price.
What Delays or Erases Payback
Payback projections slip when one of the savings components fails to land as planned. The most common causes are worth checking before the proposal is approved.
Under-counted labor. If the model assumes operators are removed but the line still needs the same people to feed, clear jams and handle exceptions, the labor saving does not appear. Watch the retained-operator workload after commissioning; a cell that needs a dedicated attendant is not the labor saving the spreadsheet assumed.
Slow commissioning ramp. A new line rarely runs at target efficiency in the first weeks. Recipe settling, operator learning and minor mechanical tuning extend the ramp, and every week of reduced output pushes payback out. Build a three- to six-month ramp into the model rather than assuming day-one performance.
Reliability and downtime. A machine that jams or fails often converts expected savings into unplanned downtime. Spare-parts lead time compounds this: a four-week wait for a critical part means a stopped cell earns nothing while the clock runs. Check MTBF commitments and regional parts support before trusting the payback number.
Product and SKU change. A machine sized for today’s product mix can underperform when taller cartons, bundled trays or new SKUs arrive. If the range changes faster than the machine’s changeover flexibility, waste and downtime rise after install. Specify quick-size change and recipe recall for a mixed-SKU line.
Material specification lock-in. A line that demands a narrow film, board or tape specification transfers ongoing material cost to your procurement. Compare the consumable basket each machine forces you to buy, not just the machine price.
Small-Plant Example: One-Shift Carton Sealing
A smaller plant runs one shift packing cosmetic cartons by hand. Two operators tape and seal cases, with occasional overtime during monthly restock. The team evaluates a semi-automatic case sealer plus a basic inline sealer rather than a full robotic cell.
Current labor: two operators at $38k loaded each = $76k a year, plus about $12k a year in overtime and rework. Material waste from hand taping and crushed cartons runs roughly $9k a year. The proposed equipment totals $42k installed. After install, one operator runs the cell and handles exceptions; the second role is redeployed to packing. Net labor saving around $38k a year, plus $6k a year in reduced waste, less $3k a year in maintenance and consumables, leaves net annual savings near $41k.
Payback: $42,000 ÷ $41,000 ≈ 1.02 years, about 12 months. This is the smaller-investment end of packaging automation: a simple machine matched to a one-shift, limited-SKU operation can pay back quickly without a full end-of-line build. For the equipment-side comparison, the case sealer buying guide, semi-automatic and inline adaptive walks through the machine classes that fit this scale.
The Numbers to Gather Before You Model
A defensible ROI model starts from your plant’s current baseline, not from vendor claims. Collect these before you request quotations.
- Current labor: operators per station, loaded hourly cost, overtime and temp hours, supervision time on the cell, turnover training cost.
- Current waste: weekly tape, film, strap and carton loss; damaged and returned cases per month; the cost of a finished pack.
- Throughput: current cases per shift, whether the line is the bottleneck, and the margin earned on each extra case you could sell.
- Shift and SKU profile: shifts per day, case and pack sizes, expected product additions over three to five years, changeover frequency.
- Utility baseline: current power and compressed-air use near the cell, so the new machine’s added draw can be priced locally.
On the vendor side, request connected load in kW, air consumption, availability or MTBF commitment, changeover time, spare-parts lead times and the included wear-parts kit. Where a proposal leaves a figure blank, treat it as an open scope question rather than a zero. The end-of-line packaging line cost and budget guide 2026 lists the budget line items a complete end-of-line proposal should cover.
Your Packaging Investment ROI Checklist
Before you approve any packaging equipment purchase, run through this checklist:
1. Count all the labor: operators, overtime, temp labor, supervision, night-shift premium, turnover training. Not just base salary.
2. Measure your current waste: how much tape, film, strap and how many damaged cartons per week? Get real numbers, not guesses.
3. Calculate throughput gain: if packaging is your bottleneck, every extra case per minute is worth money. How much margin does each case earn?
4. Include hidden costs: installation, training, maintenance, utilities, transition downtime, integration and controls.
5. Subtract new running cost: maintenance, air, power and consumables on the new machine come out of gross savings before payback is calculated.
6. Be conservative: assume savings come in six months later than predicted. Even with conservative numbers, most good investments still pay back in under two years.
7. Check reliability and support: MTBF, spare-parts lead time and local service matter, because a machine that is down does not generate savings on schedule. Confirm how quickly critical parts can reach your region and whether the control hardware is mainstream and serviceable rather than proprietary.
8. Compare on the same scope: every bid must include installation, training, guards, conveyors and controls before you judge the price. A machine-only quote next to a turnkey quote will always look cheaper, and that gap is a scope difference, not a saving.
Background Sources
- PMMI market research and packaging industry surveys — labor, automation and secondary packaging trends.
- Statista industrial and packaging automation equipment data — adoption and segment background.
- ISO machinery safety standards overview — safety and guarding baseline in equipment comparisons.
- OSHA material handling and workstation guidance — manual handling and safety context.
Example figures are planning bands, ex-works and before installation, controls, freight and tooling. Build your own model on local labor, utility and material rates.
Frequently Asked Questions
For most packaging automation, a payback period under 24 months is excellent. Under 18 months is very strong. Over 36 months needs careful justification, unless the machine is enabling growth or solving a safety problem that cannot be handled manually.
Not always, but usually. A machine that costs 30% less but breaks down twice as often and produces 3% more waste will cost more over five years. Always compare total cost of ownership and net savings, not just purchase price.
Use real numbers from your own operation. Show current labor cost, current waste rate and current overtime, then the conservative savings. Frame it as growth enablement, not just cost cutting. Most finance teams respond to a clear 12–18 month payback story.
Used machines can have good ROI for simple, reliable equipment such as conveyors and basic case sealers. For complex automatic machines like robotic palletizers and high-speed wrappers, new is usually better ROI because of warranty, support, energy efficiency and parts availability.
Forgetting to count all the labor, and forgetting to subtract the new machine’s own running cost. They count one operator standing by the machine, but miss the supervisor troubleshooting, month-end overtime and peak-season temp labor, then divide gross savings instead of net.
Get Your Custom ROI Analysis
Send us your current labor setup, production volume and waste rate — we’ll build a custom ROI calculation for your operation, showing real payback period and total five-year savings.

Ryan translates customer product, package and production data into a machine configuration and quotation: package format review, throughput estimation, machine type selection, optional equipment, spare parts, lead time and payback calculations. His articles help overseas buyers prepare a complete application brief and understand how configuration choices change price and output.
See Full Bio ›