
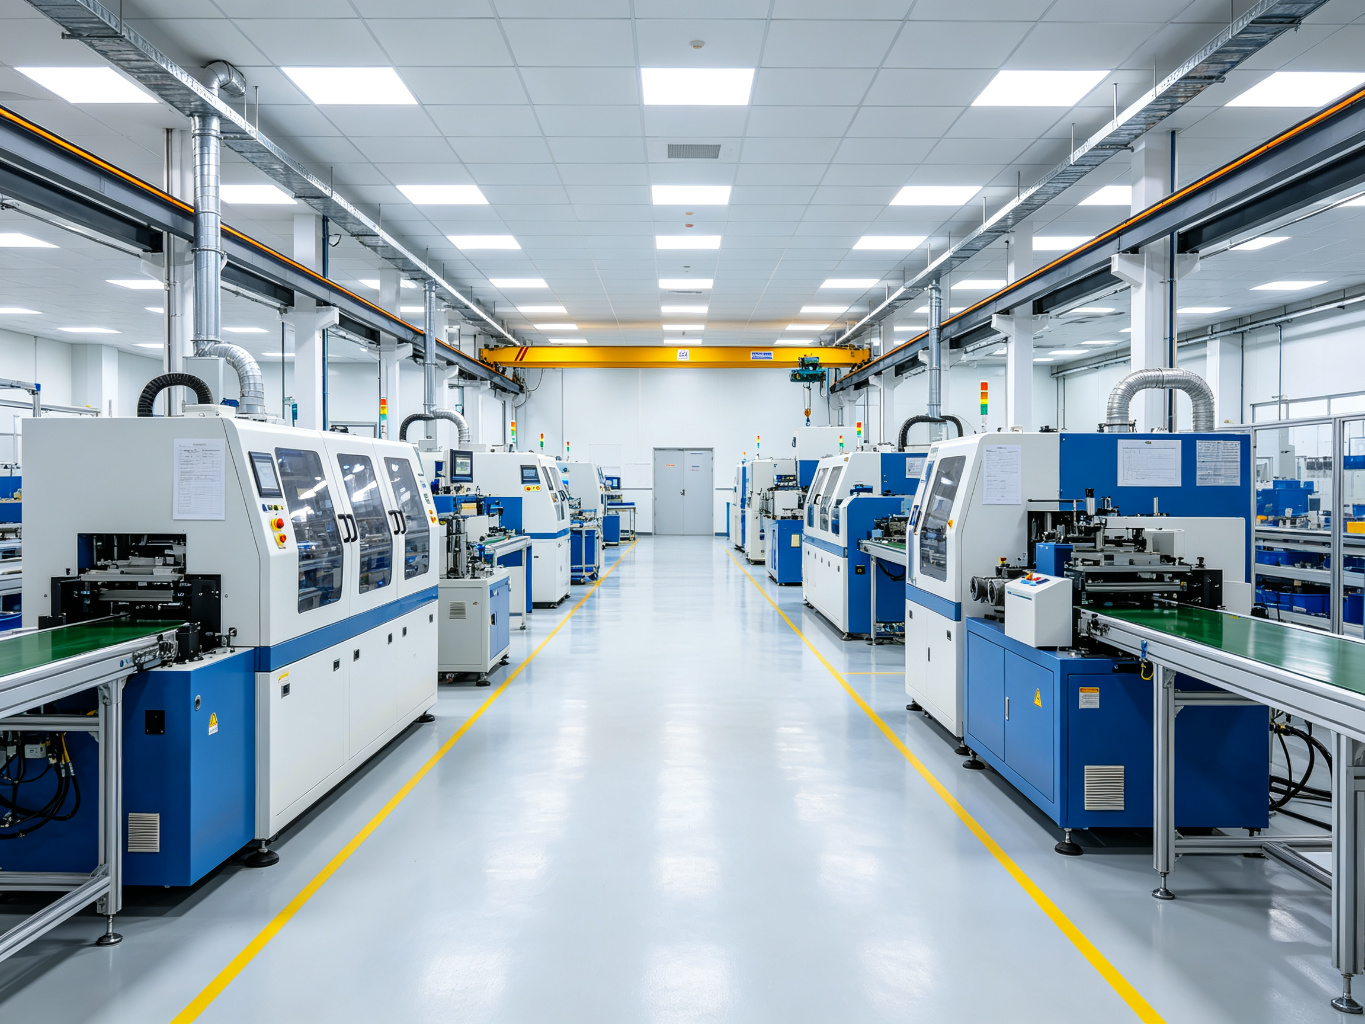
TL;DR. End-of-line packaging equipment is becoming easier to connect, and buyers are asking what the data actually buys them: fewer unplanned stops, a clearer picture of downtime, and earlier warning on wear before a jam or failure. In 2026, the choice on most floor is not whether to install sensors, but how much visibility to add and how it fits the machines already running. This report walks through what is moving in connected end-of-line equipment, why downtime data matters on packing and palletizing lines, what data modern machines capture, the four approaches buyers compare from manual logs to connected OEE dashboards and condition sensors, how OEE is worked out on a packaging line, what condition monitoring watches for, what to connect first, the 2026 cost and adoption picture, what the trend means for your buying decision, the five questions to ask before adding monitoring, and the scenario fit for high-rate single-line plants, mixed-SKU floors and older retrofitted lines. Figures below are planning ranges for discussion, not promised availability, performance or savings; actual OEE, downtime and monitoring results follow your machines, product mix, data setup and operating practice.
By Michael Zhang, End-of-Line Automation and Downtime Analyst. Michael has spent 8 years working on wrapping, sealing, case packing and palletizing lines, tracking stop reasons, OEE losses and condition-monitoring pilots across distribution, food and household-goods plants.
What is moving with connected end-of-line equipment in 2026
For years, most end-of-line machines recorded what they did on their own HMI: a counter, a fault code, a cycle count. Operators noted stops on paper or in a shift log, and the plant pieced together downtime after the fact. That picture is coarse. It shows that a line stopped, but not usually why it stopped, how long each stop lasted, which station caused it, or whether the same issue repeats across shifts. In 2026, machine controllers, edge gateways and cloud or local dashboards make it practical to collect stop reasons, cycle rates and wear signals from wrappers, sealers, case packers and palletizers in one view.
The push comes from both sides. Plants under labor pressure want to know where throughput goes without adding manual reporting. Machine suppliers ship controllers that expose process data through standard protocols, and older machines can often be retrofitted with sensors and counters. The trend is not a single robot or smart machine; it is the layer of data around existing end-of-line equipment that lets a manager see the line as it runs rather than reconstruct it from end-of-shift logs.
Buyers entering this review usually start from a few questions: how much of our downtime we can explain today, which station loses the most time, whether the current machines already expose usable data, and whether a new purchase should ship ready to connect. Before comparing approaches, fix the line facts: which machines make up the end-of-line flow, their age and controller type, how stop reasons are recorded today, the planned OEE or throughput target, whether the plant already runs an MES, dashboard or data historian, and what network and controls access the maintenance and production team can support.
Why downtime data matters on an end-of-line line
End-of-line stations depend on each other. A sealer that jams backs up the case packer; a wrapper that stops leaves pallets waiting; a palletizer fault can idle the whole stretch of line behind it. Because the stations are coupled, downtime at one point spreads across the flow, and the bottleneck that matters is the station that limits the whole line, not the fastest machine on its own. Without station-level data, the line balances to guesswork, and improvement effort lands on whatever station the loudest complaint names.
Downtime breaks into a few categories that matter differently. Planned stops are changeover, cleaning, scheduled maintenance and breaks, which the line schedule already accounts for. Unplanned stops are jams, faults, feed misalignment, product or material shortages, and equipment wear, which eat throughput the line was supposed to deliver. Some losses are slow rather than hard stops: a machine that cycles but under-paces, mis-feeds at a low rate, or runs at reduced speed after a fault, which a stop counter alone does not catch.
Good downtime data separates these so the team can act on the biggest loss first. It tells them whether lost time comes from long changeovers, frequent small jams, weak upstream feeding, or equipment that needs service. A plant that only knows total stop minutes cannot tell whether to train operators on changeover, tune a feeder, or schedule maintenance. The data also repeats the same measure across shifts and lines, so comparison does not depend on who filled in the log that day.
What data modern end-of-line machines capture
At a basic level, a machine reports cycle or pack count, run and stop status, alarm or fault codes, and running time. From those, a dashboard can compute cycle rate, stop count and alarm frequency. The next layer adds context: which fault or stop reason appeared, how long each event lasted, and the count of good versus rejected packs. On wrappers and palletizers, this can include film or band usage, pallet count and pattern change; on sealers and case packers, carton or case count, seal faults and jam location.
Some machines expose process signals that carry wear information: motor or servo current, drive temperature, air pressure, seal temperature, wrapper tension, encoder position or cycle timing. These signals trend over time rather than flag a single alarm, and they show a component drifting before it fails. Newer controllers expose these through standard protocols; older machines may need external sensors to capture the same signals.
Rejected and off-quality packs matter as much as stop time. A line that runs fast but ejects damaged cases, mis-strapped pallets or mis-loaded bundles still loses throughput and material. Quality signals from reject gates, vision checks or product sensors feed the quality part of OEE. Without them, the line looks available and fast while quietly throwing away product.
Four approaches buyers compare
The table below compares the four levels of visibility plants adopt, from manual record-keeping to connected dashboards and sensor-based condition monitoring. The comparison covers the data captured, the setup it needs, the downtime picture it gives, the cost position and the type of line it suits.
| Approach | Data captured | Setup and access | Downtime picture | Planning cost position | Best fit |
|---|---|---|---|---|---|
| Manual shift logs and clipboard | Operator-noted stops, rough reasons, shift totals | No machine connection; depends on operator entry and consistency | Coarse total downtime; reason quality varies by shift | Lowest capital; high manual labor and inconsistent data | Low-volume lines where formal OEE is not yet required |
| Machine PLC/HMI counters and alarms | Cycle count, run/stop, fault codes, runtime on the local HMI | Read at the machine; limited roll-up across stations | Per-machine run and alarms; weak cross-line and stop-reason view | Built into the controller; little extra hardware | Individual machine troubleshooting and baseline check |
| Connected OEE dashboard | Station counts, stop events, reasons, run and reject data rolled into one view | Gateway or controller connection to local or cloud dashboard; data mapping and line setup | Availability, performance and quality per station; repeatable shift and line comparison | Mid-range hardware, integration and setup; recurring dashboard or platform cost | Multi-station end-of-line flows where throughput is tracked formally |
| Condition monitoring sensors | Trending wear signals: vibration, temperature, current, pressure, cycle timing | Sensors or controller signals routed to a monitoring view; baseline and thresholds set | Early warning on wear and drift before alarm or failure; complements OEE | Sensors, wiring, setup and analysis added to the line | Critical high-rate machines and assets where unplanned stop cost is high |
Most plants do not jump from clipboard to full condition monitoring at once. A common path reads the machine counters first to set a baseline, connects the stations to an OEE dashboard to expose where time goes, then adds condition sensors on the machines whose unplanned stop costs the most. The four levels are layers rather than competitors: the OEE dashboard tells you how the line runs, and condition monitoring tells you which part is wearing out.
Manual logs and local counters as the baseline
Manual logs and machine counters remain where formal measurement has not been built out. They are useful for a first baseline: collect what the line already shows, note the obvious stop reasons, and record cycle counts over a week of real shifts. Even without a dashboard, this baseline shows whether the problem is frequent jams, slow changeover, upstream shortages or one weak station. It also sets the numbers a later system should reproduce, so the new dashboard can be checked against the known floor reality.
Connected OEE dashboards for the whole end-of-line flow
A connected OEE view pulls station data into one line-level picture. Each machine reports count, status and stop events to a dashboard, which rolls availability, performance and quality across the flow. Managers see which station dropped behind, how long a stop lasted, which reason repeats, and whether a shift or product change shifts the loss. This is the level that turns machine-level alarms into line-level decisions about balancing, staffing or maintenance.
The setup work sits in data mapping, not only hardware. Stop reasons need to be mapped to categories the team acts on, reject signals need a source, and the dashboard needs to match how the plant records changeover and planned downtime. A poorly mapped system collects numbers the floor does not recognize, and the operators stop trusting the report. Specify the reason categories, shift calendar and reject definitions alongside the dashboard platform.
Condition monitoring on critical machines
Condition monitoring watches the signals that lead to failure, rather than waiting for the alarm. Vibration on a drive or conveyor, bearing temperature, servo or motor current draw, air pressure, seal temperature drift or irregular cycle timing can trend upward weeks before a fault. The system compares current readings against a baseline and flags the drift for planned service, so the part is replaced at a convenient stop rather than during a rush run.
It suits machines where an unplanned stop carries high cost: high-rate palletizers, wrappers feeding a full distribution line, sealers that gate dispatch. It is less justified on simple, low-utilization equipment where a replacement part is cheap and a stop is short. Sensors must be placed where the wear actually appears, and thresholds set from a real baseline; an alarm that fires too often becomes noise the team ignores.
How OEE is calculated on a packaging line
OEE combines three factors: availability, performance and quality. Availability accounts for unplanned stops and planned downtime that removed run time. Performance accounts for running slower than the design rate, micro-stops and under-pacing. Quality accounts for rejected or off-spec product that did not leave as a good pack. Multiplying the three gives the good-pack output relative to the planned run time.
On an end-of-line line, each station contributes its own availability, performance and quality, and the line result follows the tightest station. A wrapper that holds rate but feeds an inconsistent load can drag the palletizer; a sealer that runs fast but rejects cases can lose quality the wrapper never sees. Measure station by station before computing a single line OEE, or the number hides which factor to fix.
Set the baseline rate and planned time carefully. The performance factor compares actual cycle count against a realistic planned rate for that product, not an ideal showroom speed. Changeover, cleaning and scheduled maintenance belong in planned downtime rather than availability loss. If these definitions are loose, the OEE number looks reasonable but does not match what the floor experiences, and the team discounts it.
What to connect first on an existing line
For an installed end-of-line flow, the highest-value connection is usually the station the current baseline shows as the bottleneck, plus any machine whose unplanned stop idles the line. Do not connect every machine to a dashboard before knowing where the losses are. Read local counters and logs for a baseline, rank stations by stop time and lost throughput, then wire the weak stations first.
Check what each controller already exposes before buying hardware. Newer machines may offer a standard protocol and process data out of the box; older PLCs may need a gateway, counter input or external sensor to report status and count. Confirm whether the machine supplier opens the data, and what interface the dashboard expects. A machine that keeps its data proprietary may need a retrofit sensor to participate.
Leave room for the rest of the flow. The dashboard, network and data definitions should scale to add the other stations later, rather than lock one machine to a single vendor platform. Define the stop-reason categories, shift calendar and reject definitions once, so newly connected machines drop into the same view instead of a second inconsistent report.
Cost and adoption picture in 2026
Adoption rises where labor pressure and downtime cost make visibility pay. Plants running high-rate multi-shift lines have the most to gain from OEE data, because even a small share of recovered run time across shifts adds up. Smaller or lower-volume floors may start with counters and a simple stop log, and add a dashboard once a regular bottleneck is clear.
Cost splits into hardware, integration and recurring software. Gateways, sensors, wiring and any retrofit counters are one-time capital; mapping data, setting reasons and commissioning the dashboard are integration labor; cloud dashboards or platform licenses may carry a recurring fee. Condition monitoring adds sensors and analysis on top. Compare the setup against the downtime currently lost at the targeted station, not against a generic savings percentage from a vendor pitch.
Retrofit matters. A new machine bought in 2026 can ship with controller connectivity and data points already defined, which lowers the integration step. An older line can still be monitored, but the retrofit cost and sensor choice should be priced into the review before the plant assumes it can join the system the same way.
Common barriers to getting value from monitoring
The most common barrier is collecting data without a defined action. A dashboard that shows stop minutes but has no owner, no reason category and no follow-up becomes a screen people glance at between jobs. The fix is to tie each major loss category to a responsible team and a review rhythm, so a recurring jam or long changeover leads to a tuning, training or maintenance action rather than another chart. Before purchase, write down the decisions the data should support and the person who will make them.
Integration between vendors is the second barrier. Machines from different suppliers may expose data in different formats, and a dashboard that cannot read one controller leaves that station blind. Confirm early whether the proposed platform connects to each machine brand on the line, or whether gateways and custom mapping are needed. A single-vendor dashboard that only reads its own machines can fragment the line view again.
Over-alarming and weak baselines are the third. Condition sensors set without a recorded normal baseline flag every normal cycle variation, and the team learns to ignore the alerts. Similarly, an OEE target set from an ideal speed rather than the real planned rate makes performance look poor on every product. Spend the baseline period collecting real readings, set thresholds and rates from that data, and tune the alarms down to the events that actually deserve attention.
What This Means for Your Buying Decision
If you are buying a new end-of-line machine, ask what data it exposes out of the box: count, status, alarms, stop reasons and any process or wear signals, and which protocol it uses. A machine ready to connect gives you the option to build OEE and monitoring later without a sensor retrofit. Specify the data points and interface in the purchase rather than discovering after delivery that the controller locks the data.
If you are running an installed line, start with a baseline before adding dashboards. Record stop reasons and counts for a real production period, identify the station that loses the most time, and connect that station first. An OEE dashboard on a line whose losses are not understood usually produces reports the floor does not act on. Condition monitoring should follow on critical machines after the baseline shows which assets fail or drift most often.
Treat connectivity as part of line balancing and maintenance planning, not a separate gadget. The dashboard should feed decisions on changeover time, feeder tuning, spare-parts stocking and planned maintenance, and it should share data definitions with any existing MES or historian. Match the monitoring level to the cost of downtime at each station, and scale up where the baseline proves the loss.
Five questions to ask before adding monitoring
- What is our current downtime picture: total stop time, main stop reasons, and which station loses the most throughput?
- Which data points does each machine already expose, through what protocol, and what retrofit sensor or gateway would older controllers need?
- How will stop reasons, planned downtime, rejects and the baseline cycle rate be defined and mapped for the OEE view?
- Which dashboard or historian receives the data, does it scale to add more stations, and who owns and checks the reports?
- What is the hardware, integration and recurring software cost, and which measured downtime loss justifies the spend on the targeted machines?
Scenario fit: who monitors what in 2026
High-rate single-product CPG lines running multiple shifts usually benefit most from a connected OEE dashboard across wrapper, sealer, packer and palletizer, with condition monitoring on the critical palletizer or wrapper. Mixed-SKU co-pack floors, where changeover and product variety drive stops, often start with stop-reason tracking to compare changeover and feed issues before adding wear sensors. Older retrofitted lines may connect counters and status through gateways first, and reserve full condition monitoring for the machines where unplanned stops are expensive.
If your line mixes new and older machines, plan the connection in stages: baseline on local counters, connect the weak station to the OEE view, then add sensors where the baseline shows recurring wear. The useful next step is a two-week stop and count review on the real line, before any dashboard or sensor purchase, so the monitoring spend follows measured losses rather than a generic automation trend. Record each station count and stop reason across real shifts, then rank the losses by how much good-pack output each one removes.
For machine-to-machine connectivity and system integration, see the connected end-of-line machines guide, spare-parts and downtime handling in the spare-parts and downtime guide, and line balancing and throughput in the line balancing guide. Palletizer automation levels are covered in the palletizer buying guide, and downstream packing in the case packer buying guide.
Common loss patterns seen on end-of-line lines
When stop data comes out of a real line, the losses usually cluster into a handful of repeat patterns. Frequent small jams are the easiest to miss in a log that only records long stops: each jam lasts under a minute, but dozens across a shift add up to meaningful lost time. These often trace to feeder alignment, carton or case condition, film or band feed, or product that shifts before the station. A connected view that captures short stops separates this from a few long faults, which a paper log tends to lump together as line downtime.
Changeover loss shows up on mixed-SKU and seasonal lines. The line stops between product, carton or pallet changes, and the stop time depends on recipe recall, change parts and operator practice. OEE data tags changeover as planned or setup time so it is not mistaken for equipment failure, but it still compares how long each change takes across shifts and products. This is where change-part storage, recipe setup and training show up as measurable time rather than a vague sense that changeovers are slow.
Upstream and material shortages stop the end-of-line even though the machine itself is fine. Cases, cartons, film, strap or product can run low, and the downstream machine waits for the feed. Station-level data flags whether the stop belongs to the wrapper waiting on product or the upstream feeder that under-delivered, which keeps maintenance from chasing a fault that is really a supply or sequencing issue. Wear-driven faults form the last pattern: bearings, belts, seals, drives or feed components degrade over time, and the stop frequency or cycle irregularity rises before the full failure. Condition monitoring targets this pattern specifically.
Data ownership, access and maintenance practice
A dashboard only helps if someone acts on it. Before a system goes in, decide who reviews the reports, how often, and what action each loss category triggers. Production supervisors may read the line-level OEE and stop reasons; maintenance uses fault and wear signals; planning uses changeover and downtime to schedule runs. If no owner is assigned, the data accumulates but the floor keeps running the same way, and the project is judged a failure despite working correctly.
Report definitions need agreement across shifts. Stop-reason categories, planned downtime, reject definition and baseline rate should be written down once, so a stop logged as feeder fault on one shift is not logged as product issue on another. Operators should be trained to record or confirm reasons where the system relies on manual entry, and the dashboard should be checked against a known shift so the numbers match floor reality. A report the operators do not trust stops being used.
Network and access matter for an installed plant. Connected machines sit on the production network, and the data path should be separated from any business network according to the plant’s IT practice. Confirm where the dashboard runs, local or cloud, how data is transmitted, and who holds access credentials. Sensors and counters on old machines also need periodic check: a mis-wired counter or drifted sensor makes the OEE read wrong, so baseline readings should be verified against the machine before the numbers drive decisions.
Retrofit options for older packaging machines
Older end-of-line equipment is not locked out of visibility, but the retrofit depends on what the controller offers. A basic retrofit adds a run-stop sensor, a pack or cycle counter and possibly an alarm read from the machine, so the station can report status and count to a dashboard. This covers availability and performance where the old PLC cannot expose internal signals. It is the common first step on a sealer, wrapper or palletizer that still runs mechanically but has no data port.
Where the controller has a usable communication port, a gateway can pull existing counters, alarms and some process signals without adding external sensors. Check whether the controller protocol supports the data the dashboard needs, and whether the machine supplier allows access. If the controller is sealed or obsolete, external sensors often become the practical route: current or current-sensing on drives, temperature probes, vibration sensors on rotating parts, and photo or proximity counters for pack flow.
Condition monitoring on a retrofit should stay targeted. Sensors on every moving part add wiring and calibration cost that a low-utilization machine does not justify. Fit them to the components whose failure stops the line, set thresholds from a recorded baseline, and review the first weeks of readings to filter out alarms that fire on normal cycle variation. The retrofit should be planned so the new counters and sensors share the same dashboard and reason categories as newer machines on the line.
References and background sources
The connectivity, OEE and condition-monitoring reasoning in this report follows standard end-of-line automation practice and our floor audits. Adoption and equipment context draws on public industry sources: the PMMI market research overview on packaging machinery and automation, the Statista industrial robots topic on end-of-line automation, the IFR World Robotics report on robot adoption in packaging, and the ISO 13849-1 machinery safety standard for controlled and guarded equipment. OEE targets, downtime percentages and savings figures are planning references only; verified results follow your machines, product mix, data definitions and operating practice.
Frequently asked questions

Michael designs automated palletizing stations and ties upstream case or bag flow to downstream stretch wrapping. His work spans conventional layer palletizers, robotic arm cells, conveyor routing, safety fencing and handover logic between machines. He writes about palletizer selection, load stability and how an end-of-line sequence should be balanced.
See Full Bio ›